Crypto Market Updates
Real-time insights on blockchain, DeFi, and digital assets
Learn About Andrew Hansen and His Passion
Explore Andrew’s journey and dedication to sharing valuable insights on AI and cryptocurrency with a vibrant community of readers.


Stay Ahead of the Markets
Join 50,000+ investors who read MarketIQ every morning.
Get sharp, data-driven market insights delivered to your inbox — free. Covering stocks, crypto, commodities and macroeconomics.
No spam. Unsubscribe anytime.
Our Expertise
Explore Our Articles and information on AI
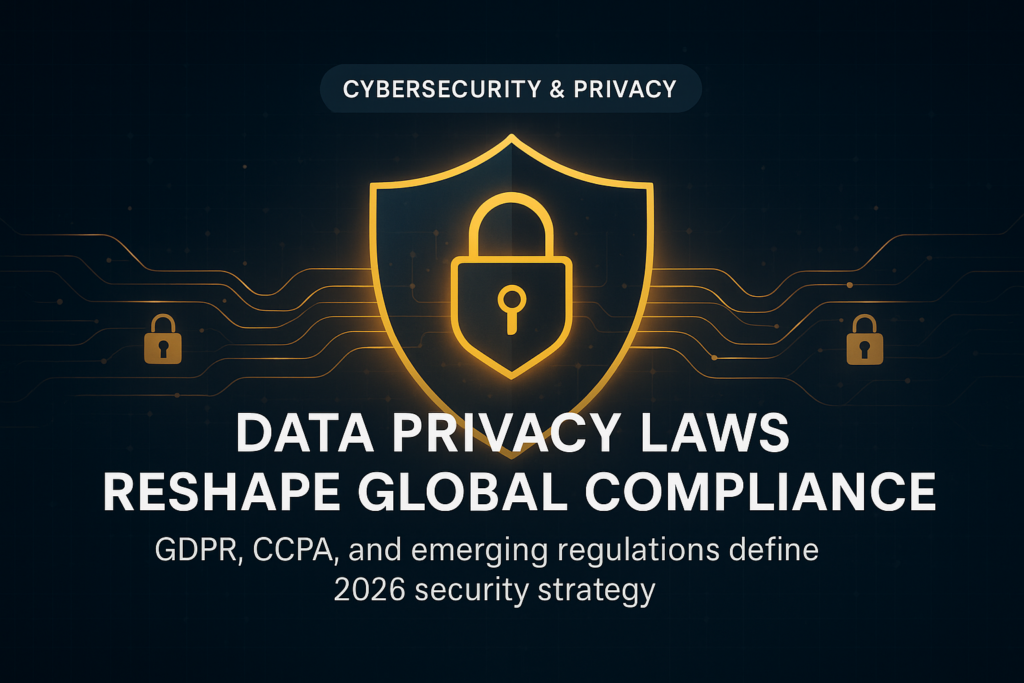
Global Data Privacy Legislation 2026: GDPR, CCPA, and Emerging Regulatory Frameworks

Cloud Security Best Practices 2026: Zero Trust, Identity-First Protection & Compliance

How AI and Blockchain Are Revolutionizing Cybersecurity in 2026

Generative AI Enterprise Applications: Transforming Business Operations in 2026

Edge Computing, AI Infrastructure, and Distributed Cloud: The Future of Cloud Computing in 2026

AI-Powered Robotics Automation: How Intelligent Machines Are Reshaping Manufacturing in 2026
Explore Our Insights and information on Crypto
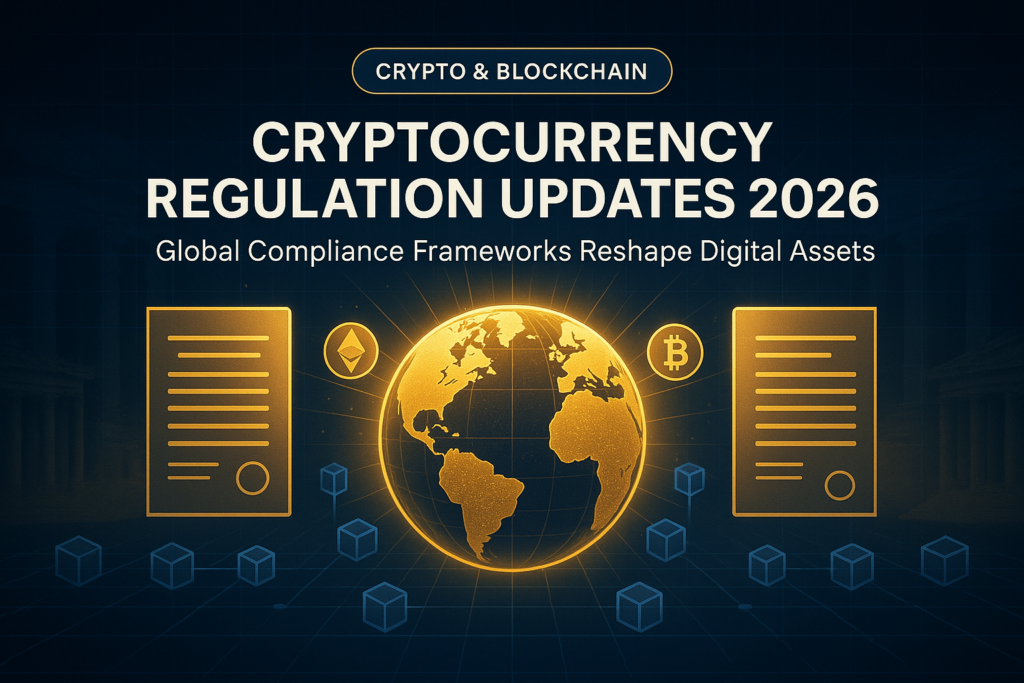
Cryptocurrency Regulation Updates 2026: What Governments Are Doing Now
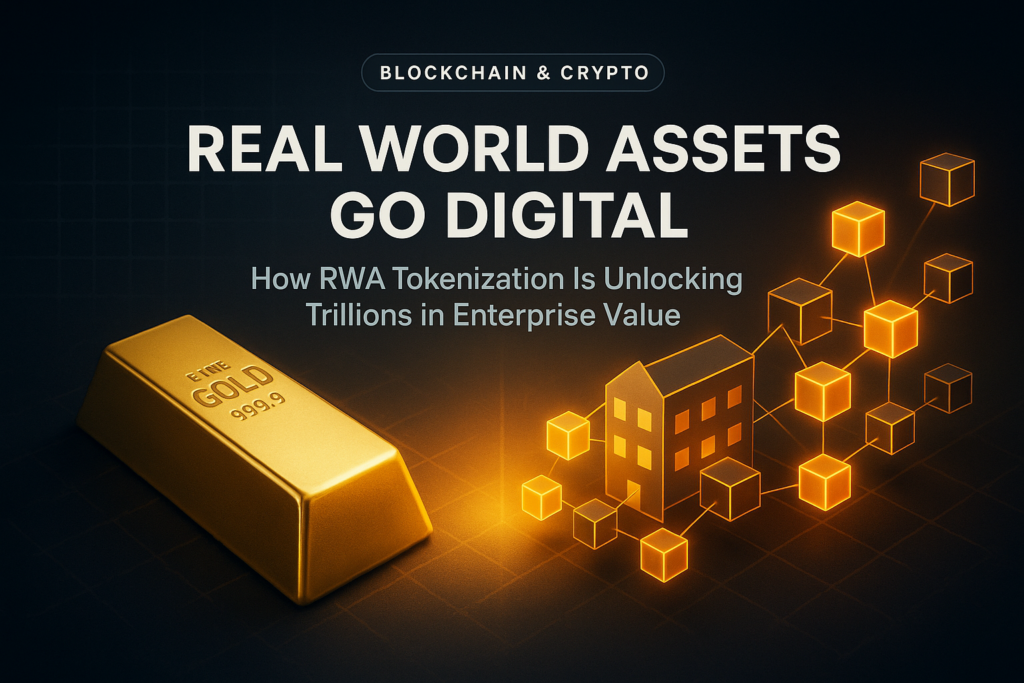
Real World Asset Tokenization: How RWA Is Becoming the Blockchain’s Killer App in 2026

Crypto M&A Surge in 2026: Industry Consolidation Accelerates as Major Players Reshape the Blockchain Landscape
How AI and Blockchain Are Revolutionizing Cybersecurity in 2026
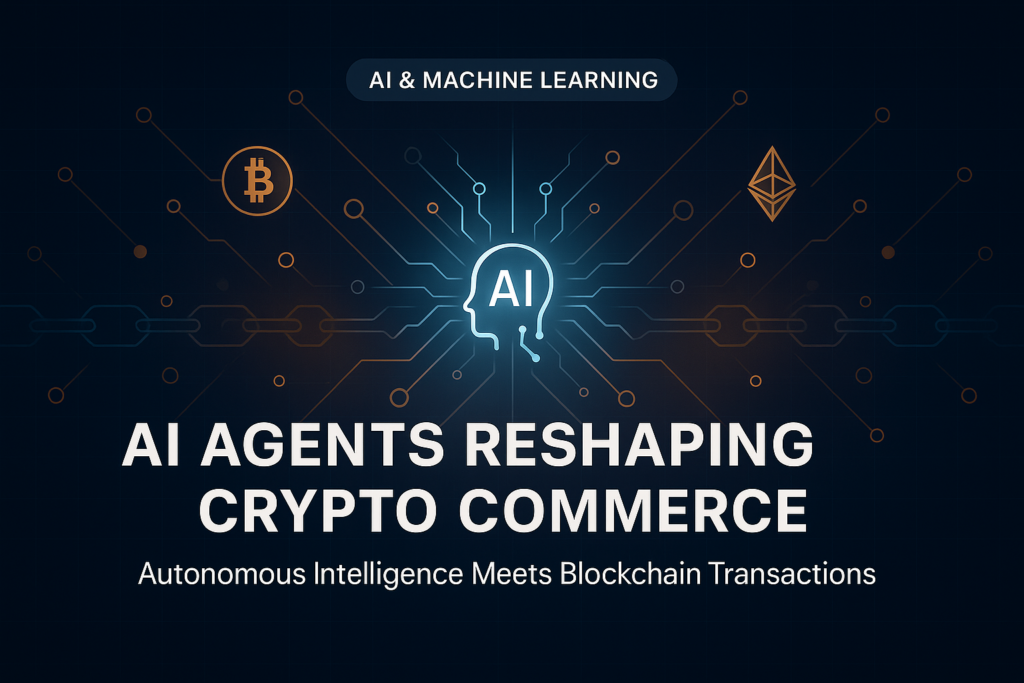
AI Agents in Crypto Commerce: How Autonomous Intelligence is Reshaping Blockchain Transactions in 2026
NFT Evolution: From Digital Art to Utility-Driven Ownership in 2026
Crypto Weekly: Fear Persists as ETH, LINK Lead Gains
Published July 16, 2026
Executive Summary
Crypto markets traded range-bound this week as sentiment hovered in the Fear to Neutral zone. Selective rotation favored Ethereum, Chainlink, and privacy-focused assets, while stablecoin and credit-market headlines underscored continued infrastructure maturation despite subdued risk appetite.
Market Overview
- Liquidity and breadth: Large caps were mostly flat to modestly higher; mid-caps showed mixed performance with narrower breadth.
- Derivatives: Funding stayed near neutral; implied volatility remained contained, signaling balanced positioning rather than aggressive risk-taking.
- On-chain activity: L2 throughput and stablecoin settlement volumes were steady, reflecting ongoing real-world usage even as prices chopped.
Fear & Greed Analysis
Risk sentiment spent the week anchored in Fear, with brief upticks that faded quickly. Historically, such regimes compress leverage and can set the stage for asymmetric upside if clear catalysts emerge, but near term they favor disciplined rotation and quality-focused exposure.
Trending & Noteworthy
- Ethereum (ETH): Sustained relative strength as attention returned to staking yields, rollup economics, and improving developer momentum.
- Chainlink (LINK): Continued demand for oracle and cross-chain messaging services supported a constructive bias on pullbacks.
- Privacy cohort: Select privacy tokens outperformed on renewed discussion around data security and censorship resistance.
- DePIN and infra: Compute, storage, and oracle infrastructure names saw interest tied to real-world utility narratives.
Crypto News Roundup
- Credit expansion: New and expanded warehouse lines and lending facilities signaled healthier liquidity for market makers and structured products.
- Stablecoin rails: Additional pilots and partnerships for merchant settlement highlighted growing mainstream integration and faster cross-border flows.
- Policy watch: Ongoing CBDC debates (e.g., digital euro) and market-structure commentary kept regulatory clarity in focus as a potential medium-term catalyst.
- Security & compliance: Heightened scrutiny of digital tooling reinforced the industry’s emphasis on KYC/AML controls and transaction monitoring.
AI Industry Update
- ZKML and verifiable compute: Progress in zero-knowledge proofs for model inference could enable trust-minimized, on-chain validation of AI outputs.
- Decentralized GPU markets: Token-incentivized networks advanced, aiming to reduce inference costs for bots, analytics, and research.
- AI-driven compliance: Enhanced anomaly detection tools continued improving fraud and sanctions screening efficiency for exchanges and issuers.
- Data provenance: On-chain attestations and watermarking gained traction to counter synthetic media risks and improve governance inputs.
Week Ahead Outlook
- Price and breadth: Watch if leaders can extend relative strength while breadth improves beyond a handful of infra and privacy names.
- Oracles & interoperability: Track developer updates and whale flows; follow-through could broaden beyond a single-session pop.
- Stablecoin integrations: New processor or banking partnerships would be constructive for volumes and on/off-ramp efficiency.
- Derivatives signals: Funding, basis, and term structure shifts may foreshadow changes in spot direction and risk tolerance.
- Policy milestones: Any movement on stablecoin frameworks or CBDC pilots could narrow risk premia and unlock sidelined capital.
Bottom line: With sentiment cautious but fundamentals of settlement, credit, and data infrastructure improving, selective rotation into quality remains the path of least resistance. Clear policy signals or advances in verifiable AI compute could provide the catalysts needed to resolve the current price range.
⚠️ Registered Crypto Scam Database
| Scam Name | Type | Network | Est. Losses | Status | Reported |
|---|---|---|---|---|---|
| Phishing: 850337crypto.com | Phishing | Multiple | — | Active | Jul 16, 2026 |
| Phishing: 691223-crypto.com | Phishing | Multiple | — | Active | Jul 16, 2026 |
| Fake HSBC bank stablecoins hit the market showcasing dangerous new crypto scam wave – CryptoSlate | Impersonation | Unknown | — | Under Investigation | Jul 16, 2026 |
| Phishing: 765469-crypto.com | Phishing | Multiple | — | Active | Jul 15, 2026 |
| Phishing: 170143-crypto.com | Phishing | Multiple | — | Active | Jul 14, 2026 |
| SAPD to display warning about Bitcoin scams through cryptocurrency ATMs – kens5.com | Scam | Bitcoin | — | Under Investigation | Jul 12, 2026 |
| Fake Token: app-lukcytoken.pages.dev | Fake Token | Multiple | — | Active | Jul 12, 2026 |
| Fake Token: apk-imtoken.com | Fake Token | Multiple | — | Active | Jul 12, 2026 |
| Fake Wallet: access-dfillma-wallet-eng.pages.dev | Fake Wallet | Multiple | — | Active | Jul 12, 2026 |
| Fake Wallet: afgwallet.com | Fake Wallet | Multiple | — | Active | Jul 11, 2026 |
Stay Updated
Get notified when we publish new content and receive our weekly reports.
What Sets Us Apart
Distinct Perspectives and Genuine Details on AI and Cryptocurrency.

Engaging Content
Andrew breaks down intricate concepts into captivating formats, ensuring that learning is both accessible and enjoyable for all.
Community Focused
Fostering a sense of belonging, our platform encourages thoughtful discussions among readers with shared interests.
Expert Guidance
Benefit from Andrew’s expertise in AI and cryptocurrency, providing practical advice to enhance your knowledge and skills.